Virtual Server vs. Real Server Disk Drive Speed
It’s important to understand the potential differences between virtual server disk drives and physical disk drives, so I wanted to post a very brief blog on the topic. For this article I’ve chosen to compare the performance of an iSCSI SAN on Gigabit Ethernet to a single SATA disk drive. The reason for this is two-fold: first, it more starkly highlights the relative performance differences between purchasing say a single dedicated server in a hosting environment with a single disk or a virtual machine hosted in a cloud environment. Secondly, when you are looking at internal private clouds or a lot of the newer cloud offerings, they are commonly built using an iSCSI SAN backend.
To be clear, the top three U.S. clouds do not use iSCSI SANs: Amazon’s EC2, Rackspace Cloud, and GoGrid, all use local RAID subsystems. This is common knowledge. Of the early cloud pioneers, as far as I’m aware, mostly the U.K.-based clouds such as ElasticHosts and FlexiScale use iSCSI SANs. The latest set of new cloud entrants, such as Savvis, Terremark, and Hosting.com all use either iSCSI or Fiber Channel-based SANs. This is also commonly known.
Your Mileage May Vary on these performance numbers. I’m not trying to highlight any ‘right’ way to build a cloud here. I’m simply trying to show what the difference in performance is between a single SATA disk and a VM disk drive backed by an iSCSI SAN over a single Gigabit Ethernet.
This is not a robust performance and benchmarking analysis. It’s a simple “run the numbers and compare” blog posting. These are by no means authoritative performance numbers and that’s not their purpose either. Their purpose is to highlight how performance differs between a single spindle and many in a RAID configuration, even when that RAID is available via a SAN over Gigabit Ethernet.
Please avoid overly critiquing the testing technique here. It’s not meant to be robust, so nitpicking it serves no purpose.
Setup & Methodology This is a very simple test in the Cloudscaling hosting & cloud lab environment. Both servers running the test are on latest Ubuntu Jaunty Jackalope release. One is a physical server with a single SATA disk and the other is a VMware vSphere VM backed by an iSCSI LUN. The iSCSI LUN is provided by a ZFS-based SAN product called NexentaStor from Nexenta Systems. This is an OpenSolaris derivative and a very cost effective alternative to say a NetApp or EqualLogic system.
The iSCSI SAN hardware is a simple Sun x2200 M2 with a Sun J4200 JBOD and 6 15K RPM SAS drives.
The bonnie++ command line was as simple as possible:
bonnie++ -n 512
Note that the simplicity of the bonnie testing method may have caused some weird skewing of numbers. See below for more.
Basic Numbers Here is a basic high-level chart showing the numbers.
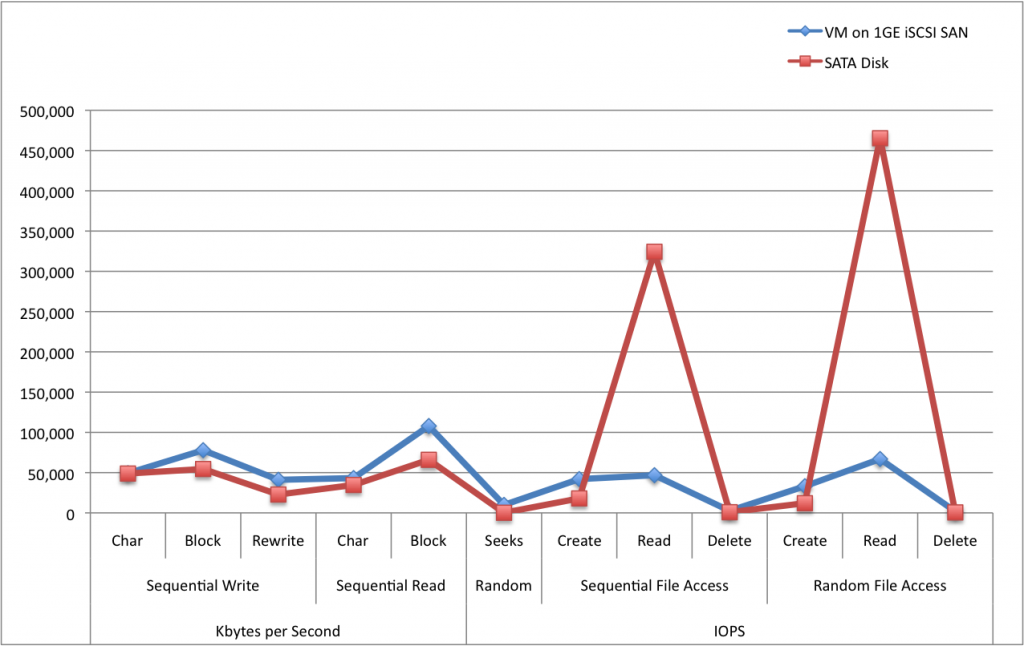 Figure 1. High level of SATA vs. VM disk
The first thing you will notice, of course, is the two big spikes for sequential and random file reads. These numbers are artificially inflated as clearly 325,000 IOPS for sequential and 460,000 IOPS for random reads are ridiculous. This is likely due to caching either in the OS or the controller on the physical box. bonnie++ is supposed to account for this, but for some reason, in this instance it did not. So it might be a little easier to evaluate the relative performance on a logarithmic scale:
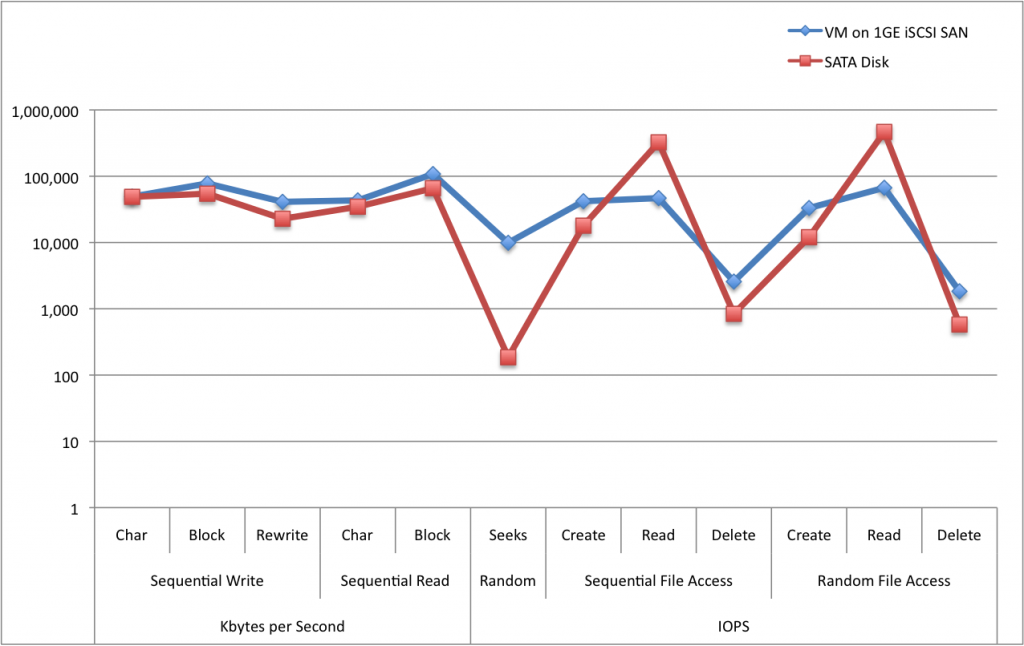 Figure 2. Logarithmic scale for test Results
Much better. What is easier to notice here is that the VM generally performs better on both standard measures of disk speed: raw throughput and disk operations (I/O per second or IOPS) with the obvious exception of the two aberrant data points.
Removing those two data points will give us an even clearer picture:
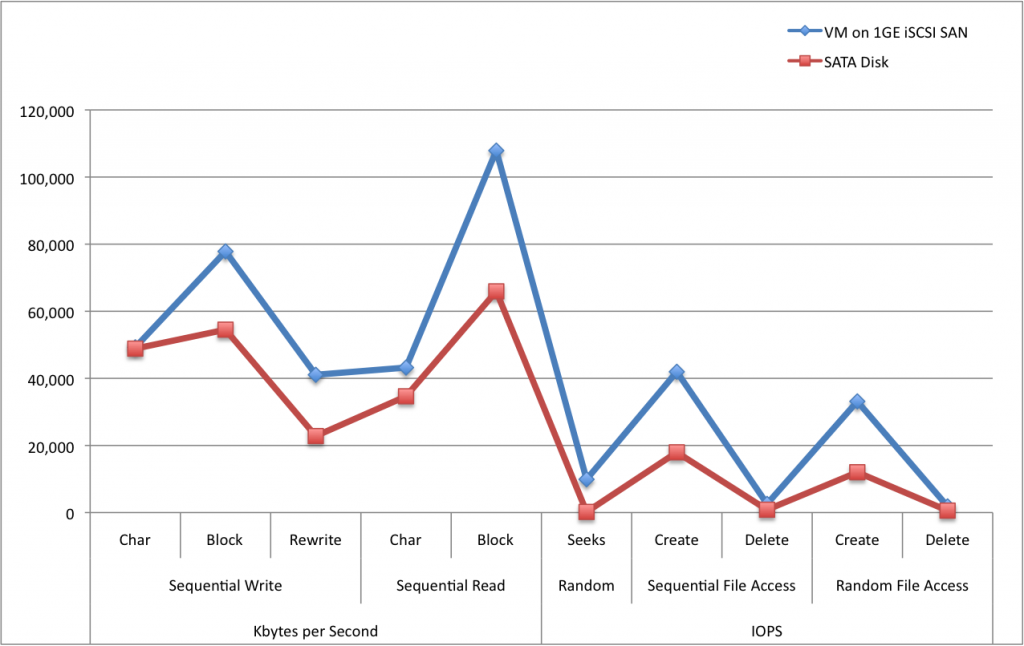 Figure 3. Normalized test results
Great. Now this is very clear. As you can see, the first half of the chart shows raw throughput (Kbytes/second). When reading blocks from the VM disk we’re nearly saturating the gigabit ethernet link which should top out at 125Mbps theoretical, and we’re hitting 107MBps on average over 10 runs, so this is quite acceptable. The SATA disk, in comparison gets just over 60MBps, which is about right, even though the SATA spec and controller are capable of more. Sustained block reads from SATA disks will typically be 60-80MBps in the real world.
Much more interesting is the number of IOPS. Many real world disk workloads, like a database spend the majority of their time doing large amounts of their ‘seeking’ from one position of the disk to another, meaning lots of random file access. They will bottleneck on waiting for the disk ‘head’ to move from one position to another on a disk drive and read new data. It’s hard to tell the difference above because the SATA disk is so slow it barely registers on the chart.
If we change to a logarithmic scale again the data becomes much easier to read:
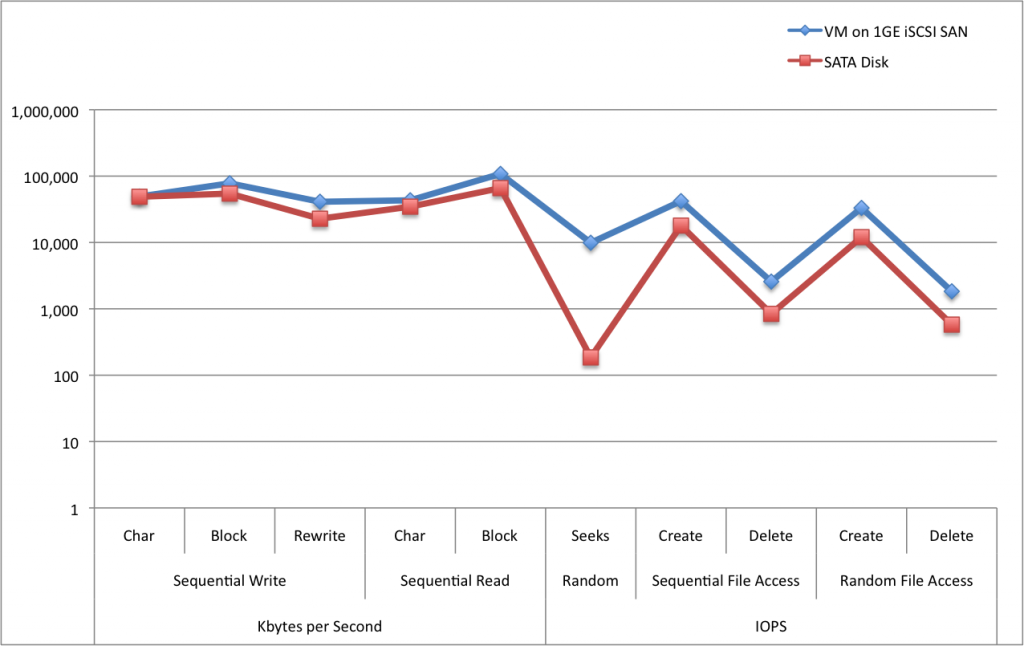 Figure 4. Normalized logarithmic scale test data
Now you can see that doing random seeks (i.e. moving the head of the disk drive from one location to a new one to read a piece of data) are starkly different. A single SATA disk gets about 185 IOPS while a set of 6 SAS disks in the SAN is right around 10,000 IOPS. This is a huge performance difference. There are several reasons for this. One, a typical SATA disk has an average latency of 8.5ms and a 15K SAS disk has only 3ms. Also, with 6 disks in a RAID configuration, I have 6x more disk heads to read with.
It’s still a bit hard to see with this chart, but for most of the rest of the IOPS tests above, the SAN solution is roughly 3x the performance of the single disk. For example, Sequential File deletion is 2,573 (SAN) vs. 840 (SATA).
Rather than going through the entire set of results, I recommend you download my simple spreadsheet.
Note that for Amazon, Rackspace, or GoGrid, local VM disk results will likely look very similar to the iSCSI SAN results for IOPS and sequential read/write (first half of chart) will be much higher.
Amazon’s Elastic Block Storage (EBS) would have similar performance characteristics to the iSCSI SAN above and hence you can see why it can be acceptable for running a database.
Summary My point here is very simple. I want to highlight the difference between purchasing a dedicated server with a single (or small number of) SATA disks vs. going with a cloud solution that uses a shared iSCSI SAN or local RAID on a single physical node. Purchasing your own dedicated server solution with a RAID can be extremely costly compared to a similar cloud solution.
More importantly, for those workloads that require random I/O and file access, like database applications, RAID is clearly a winner. That’s why using a shared RAID (via an iSCSI SAN or a local RAID) on a physical node for your cloud VM can be a clear advantage of the cloud today.